Revenue per vehicle in shared mobility is one of the most useful indicators for understanding whether a micromobility fleet is actually generating value. It is not enough to know how many electric scooters, e-bikes or other light vehicles are active on the platform. The real question is how much each vehicle contributes to revenue and whether its usage justifies the operating costs connected to it.
For a shared mobility operator, this metric makes fleet performance easier to read. A vehicle may be available, technically ready and correctly listed in the system, but still generate very few rides. Another vehicle, instead, may produce a high volume of rentals because it is often located in the right areas, during the right time windows and with a strong utilization rate.
Revenue per vehicle in shared mobility therefore becomes an essential control metric. It helps assess operational quality, pricing effectiveness, fleet distribution and the ability of the software platform to support more precise decisions.
How to calculate revenue per vehicle in shared mobility
The basic calculation is simple: take the total revenue generated by the fleet over a specific period and divide it by the number of active vehicles during the same time frame.
The formula can be read as:
Revenue per vehicle = total revenue for the period / number of active vehicles
For example, if a fleet generates €30,000 in one month with 300 active vehicles, the average revenue per vehicle will be €100 per month. On its own, however, this number is not enough. It should always be interpreted together with costs, number of rides, average rental duration and vehicle idle time.
Revenue per vehicle in shared mobility can be calculated daily, weekly, monthly or seasonally. The right time frame depends on the type of service and the variability of demand. In tourist cities, for example, it may be useful to compare high and low season. In urban areas with strong commuting patterns, it may be more relevant to analyze the metric by weekday or time slot.
Variables operators should not ignore
To read this indicator correctly, operators should consider at least three elements:
- number of truly active vehicles, excluding those unavailable, under maintenance or out of service;
- average revenue per rental, influenced by pricing, ride duration and promotions;
- usage frequency, meaning how often each vehicle is rented within a specific period.
Without this level of analysis, the risk is to evaluate the fleet only at an aggregate level. Total revenue may look positive while hiding underperforming vehicles, inefficient areas or operating costs that are too high compared to the volume of rides generated.
Why this metric is crucial for fleet profitability
Revenue per vehicle in shared mobility is not only a revenue metric. It helps operators understand whether each asset in the fleet is contributing to profitability. In a sharing model, every vehicle carries specific costs: purchase or leasing, insurance, maintenance, charging, rebalancing, customer support, operational management and depreciation.
If average revenue per vehicle is too low, the fleet may grow in size without becoming more economically sustainable. Adding vehicles can increase territorial coverage, but it does not always improve margins. In some cases, it can even increase costs and operational complexity.
The shared micromobility sector is entering a more mature phase, where growth can no longer be measured only by fleet size or the number of cities served. Kearney, in an article on the path of micromobility toward profitability, highlights the need to consider all costs, build scalable operating models and use platforms that support more efficient decisions. In this context, revenue per vehicle in shared mobility becomes a practical metric for understanding whether each vehicle is truly contributing to operational performance.
Average revenue and average costs must be read together
A common mistake is to look only at average revenue per vehicle without comparing it with the average cost of managing that vehicle. A vehicle generating €120 per month may seem interesting, but if it costs €100 between maintenance, charging, recovery, rebalancing and management, the margin is limited.
On the other hand, a vehicle with slightly lower revenue but much lower operating costs may contribute more effectively to overall profitability. This is why the metric should be analyzed together with other operational KPIs, such as utilization rate, cost per ride, average rental duration, revenue by area and idle time.

Operational levers to improve revenue per vehicle in shared mobility
Improving revenue per vehicle in shared mobility does not simply mean increasing prices. Pricing is only one of the available levers. In many cases, average revenue grows mainly because the fleet is managed more effectively.
The first lever is vehicle distribution. A vehicle located in a low-demand area may remain idle for hours, while a vehicle in the right location can generate several rides in the same day. This is why the metric should be connected to rebalancing. The article on shared micromobility rebalancing: how to reduce operating costs and increase rides explains how fleet distribution can influence both costs and revenue.
The second lever is technical availability. A vehicle that is unavailable because of maintenance, low battery or unresolved alerts does not generate revenue. Even small recurring downtime events can reduce monthly performance. For this reason, it is useful to connect revenue analysis with predictive maintenance for shared mobility fleets, especially when the goal is to reduce downtime and repair costs.
The third lever is dynamic pricing. In certain areas or time slots, operators can work with packages, subscriptions, promotions or differentiated pricing. The goal is not only to increase the price of a single ride, but to stimulate usage, frequency and total revenue.
Practical example: two vehicles, different results
Imagine two scooters in the same fleet. The first is rented 4 times per day, with an average revenue of €2.50 per ride. Over a 30-day month, it can generate around €300. The second is rented once per day at the same average price and produces around €75 per month.
The difference does not depend on the vehicle itself, but on where it is located, when it is available and how close it is to actual demand. This example shows why revenue per vehicle in shared mobility should not be read as a static number, but as the result of many operational decisions.
One of the most effective ways to improve revenue per vehicle in shared mobility is to identify the vehicles that generate little value. Not all inactive vehicles are a problem in the same way. Some may be temporarily idle for normal reasons, while others reveal recurring inefficiencies.
A vehicle may underperform because:
- it is consistently located in a low-demand area;
- it has technical issues or insufficient battery level;
- it is not rebalanced at the right time.
This analysis helps distinguish between normal inactivity and critical inactivity. In the first case, monitoring may be enough. In the second, targeted operational action is needed: relocation, maintenance, usage incentives or a review of area coverage.
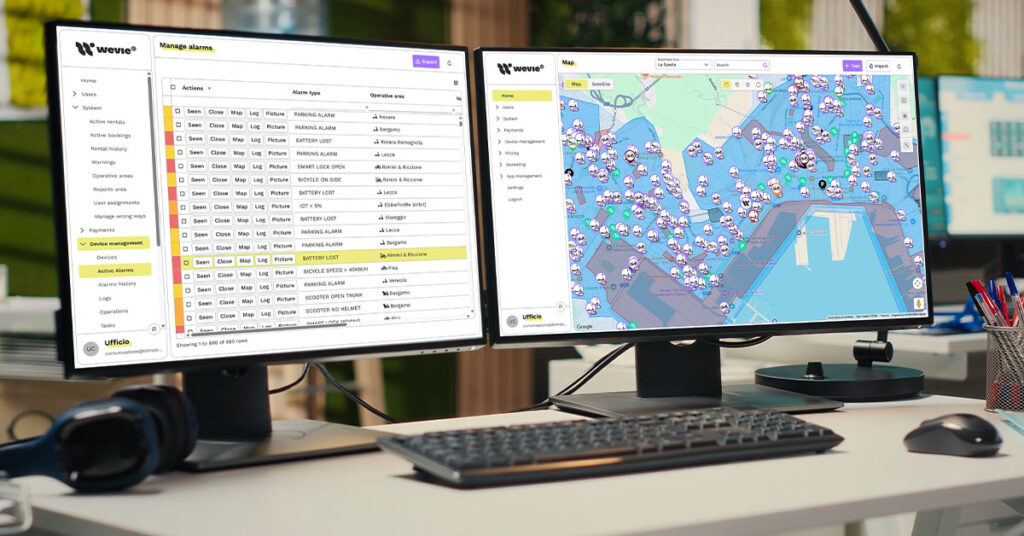
To improve revenue per vehicle in shared mobility, operators need updated data, operational visibility and tools that connect economic performance with daily fleet activities. In this sense, Wevie can support rental operators with real-time fleet monitoring, vehicle status control, zone management, alerts, operational tasks, rebalancing suggestions and analytics tools.
The benefit is not only technical. A platform like this helps operators understand which vehicles are generating revenue, which are underused, which require intervention and which areas need greater availability. For an operator, this means moving from decisions based on impressions or manual checks to a more accurate view of fleet performance.
To see how these capabilities can support day-to-day operations, explore the Wevie features for fleet management.
From average revenue to margin management
Revenue per vehicle in shared mobility is useful because it shifts attention from the total fleet to the performance of each individual asset. This change in perspective matters: a fleet is not profitable simply because it has many vehicles, but because each vehicle contributes sustainably to the overall result.
This metric should therefore be integrated into an operational dashboard together with:
- number of rides per vehicle;
- average revenue per ride;
- idle time;
- operating cost per vehicle;
- estimated margin by area or vehicle cluster.
This view allows operators to make stronger decisions: increase or reduce the fleet in a specific zone, adjust pricing, intervene on maintenance, relocate inactive vehicles or strengthen presence in the best-performing areas.
The topic is directly connected to the overall profitability of the fleet. For a broader view, the pillar article on shared micromobility profitability and fleet operating margins explains how revenue, costs, utilization rate, maintenance and rebalancing work together in building operating margin.
Turning every vehicle into a more productive asset
Improving revenue per vehicle in shared mobility means making every vehicle easier to read, easier to manage and closer to real demand. It is not only about increasing rides. It is about understanding which vehicles create value, which absorb costs and which levers can improve the result.
Revenue per vehicle in shared mobility is therefore much more than a financial KPI. It is an operational indicator that helps operators understand whether the fleet is working well, whether resources are distributed correctly and whether the business model can grow sustainably.
For micromobility operators, the decisive step is to move from an aggregate view of revenue to a vehicle-level view of performance. Only in this way can each vehicle become not just an available unit, but an asset that actively contributes to the profitability of the service.